Crypto Fear Index Hits 14: Why Extreme Sentiment Readings Have Historically Marked Market Bottoms
The Crypto Fear & Greed Index has plunged to 14 while whales accumulate 270K BTC. Examine the historical reliability of extreme fear readings as market bottom signals.
The Crypto Fear and Greed Index has plunged to 14 — its third most extreme reading since the index launched in 2018. While mainstream narratives focus on panic and capitulation, historical data tells a different story: extreme fear readings below 15 have preceded positive 30-day forward returns in approximately 80% of instances. Simultaneously, whale wallets have accumulated 270,000 BTC in the past 30 days, their largest net purchase in over 13 years. This article examines what the data actually says about sentiment extremes and their reliability as market bottom indicators.
Understanding the Fear & Greed Index: Current Reading of 14
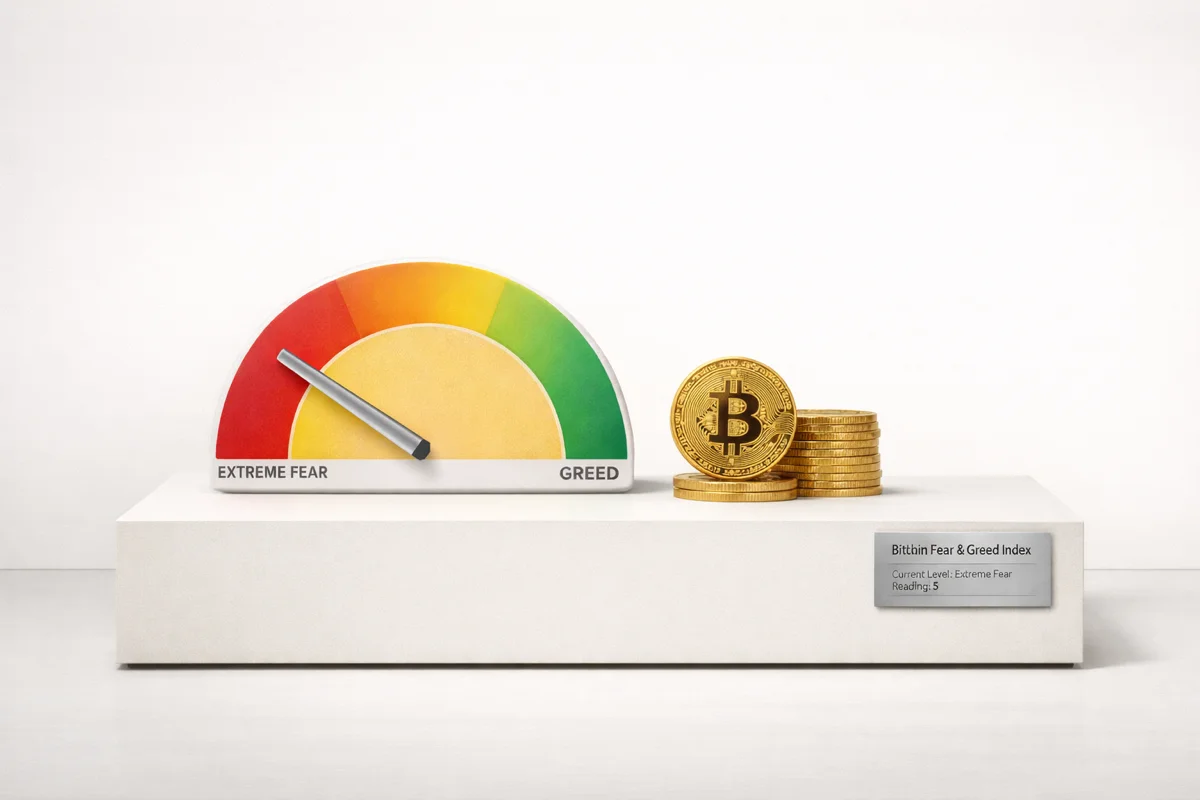
The Crypto Fear and Greed Index is a composite metric developed by CoinMarketCap that measures prevailing market sentiment on a 0–100 scale, where lower values indicate extreme fear and higher values indicate extreme greed. The current reading of 14 places the market firmly in "extreme fear" territory — the third lowest reading in the index's history, behind the COVID crash (8 in March 2020), the Terra collapse (6 in June 2022), and the February 2025 all-time low of 5.
The index derives its score from six weighted components: market volatility (25%), trading volume (25%), social media sentiment (15%), survey data (15%), Bitcoin market dominance (10%), and Google search trends for crypto-related terms (10%). When all six components converge toward pessimism simultaneously, the index produces the extreme readings observed in early March 2026.
The broader market context reinforces the fear signal. Total crypto market capitalization has contracted to $2.41 trillion, while Bitcoin dominance has climbed to 56.6% — a pattern consistent with risk-off rotation where capital flows from altcoins into Bitcoin as a relative safe haven.
Historical Extreme Fear Events and Subsequent Returns
The index's history provides a structured dataset for evaluating the predictive value of extreme fear readings. Three prior instances of sub-10 readings offer the most relevant comparisons.
During the COVID-19 market crash in March 2020, the index reached 8. Bitcoin was trading below $5,000 at the time. Within 12 months, BTC had risen above $58,000 — a gain exceeding 1,000%. The Terra ecosystem collapse in June 2022 pushed the index to 6, with Bitcoin at approximately $18,000. While recovery was slower, BTC eventually reached new all-time highs above $126,000 by late 2025.
The all-time low of 5, recorded in late February 2025, preceded a significant rally in the months that followed.
Aggregating data across all instances where the index fell below 15, historical analysis shows that the average 30-day forward return for Bitcoin has been positive in approximately 80% of cases. This statistical pattern has made extreme fear readings one of the more reliable contrarian indicators available to crypto investors — though not infallible.
The RSI Confluence: Weekly RSI at 27 Confirms Oversold Conditions
The Fear and Greed Index reading gains additional significance when combined with technical indicators. Bitcoin's weekly Relative Strength Index (RSI) has fallen to 27.48 — the lowest level since 2018.
RSI readings below 30 are traditionally classified as "oversold," indicating that selling pressure may be exhausting itself. In Bitcoin's history, the weekly RSI has fallen below 30 only three times: January 2015 (when BTC was trading at approximately $200), December 2018 (approximately $3,500), and now March 2026 (approximately $71,187).
The outcomes of the two prior instances are striking. The January 2015 oversold reading preceded a bull market that ultimately saw Bitcoin reach approximately $20,000 — a gain of roughly 9,900%. The December 2018 reading preceded a cycle that peaked above $69,000 — a gain of approximately 1,700%.
The confluence of extreme fear on the sentiment index and oversold conditions on the weekly RSI creates a dual-signal scenario that has been exceedingly rare in Bitcoin's history. Currently, Bitcoin is trading at $71,187, approximately 42% below its all-time high of $126,025.
Whale Accumulation: 270K BTC in 30 Days
While retail sentiment signals capitulation, large holders are taking the opposite approach. Wallets holding more than 1,000 BTC have collectively added approximately 270,000 BTC to their balances over the past 30 days — the largest whale net purchase in over 13 years. At current prices, this represents roughly $18.7 billion worth of Bitcoin moving into whale-tier cold storage.
This divergence between retail fear and institutional accumulation is a pattern that has historically preceded significant price recoveries. When large holders accumulate while sentiment is at its most pessimistic, it often signals that informed capital views current prices as undervalued relative to long-term expectations.
As Mercado Bitcoin Head of Research Rony Szuster noted: "Historically, buying during periods of fear has been more effective than buying during euphoria." The on-chain data supports this perspective: the volume of BTC moving to exchange deposit addresses (a proxy for sell intention) has declined even as the fear index has reached extreme levels, suggesting that selling pressure may be nearing exhaustion.
Limitations and Caveats: When Extreme Fear Does Not Mark the Bottom
Despite the compelling historical patterns, extreme fear readings do not guarantee immediate price recovery. Several important caveats apply.
First, extreme fear signals undervaluation but prices can still drop further before reversing. The 2022 bear market saw the index remain in extreme fear territory for extended periods, with prices continuing to decline for months after initial extreme readings. Market bottoms are typically processes, not events — they form over weeks or months as selling pressure gradually exhausts.
Second, the current extreme fear is amplified by geopolitical factors including regional conflict escalation, which can sustain risk-off sentiment beyond typical crypto market cycles. Unlike purely crypto-native fear events (like the Terra collapse), externally driven fear may persist regardless of crypto-specific developments.
Third, the sentiment index must be analyzed alongside fundamental and technical factors rather than in isolation. Macro conditions, regulatory developments, and liquidity dynamics all influence whether an extreme fear reading translates into a durable bottom or merely a temporary pause before further decline.
What the Data Suggests for Current Market Positioning
The current confluence of extreme fear (index at 14), oversold weekly RSI (27.48), and massive whale accumulation (270K BTC in 30 days) represents a historically rare combination. Each indicator individually has been a moderately reliable contrarian signal; their simultaneous occurrence has preceded significant recoveries in every prior instance, though sample sizes are small.
For investors considering positioning based on this data, historical evidence favors dollar-cost averaging during extreme fear periods over attempting to time exact bottoms. The data suggests that systematic buying during extreme fear has historically outperformed both lump-sum timing attempts and buying during neutral or euphoric sentiment periods.
However, patience is essential. Market bottoms form over weeks, not days. The 80% positive 30-day forward return statistic means that 20% of extreme fear instances did not produce positive short-term returns. Position sizing and risk management remain critical regardless of sentiment signals.
The bottom line: while no indicator is infallible, the current combination of sentiment extremes, technical oversold conditions, and institutional accumulation represents the type of setup that has historically rewarded patient, contrarian investors. The data does not guarantee a bottom, but it does suggest that the risk-reward profile has shifted meaningfully in favor of long-term buyers.
Sources
- Fear & Greed at 14, But Whales Are Accumulating 270,000 BTC — Spotted Crypto
- Bitcoin RSI Hits 27: Whales Accumulate 270K BTC — Spotted Crypto
- Crypto Fear and Greed Index Plummets to Record Lows — CCN
- Crypto Fear & Greed Hits 5, Marking Lowest in History — Tekedia
- Crypto Fear & Greed Index: Buying the Bitcoin Bottom — Outlook India
- Bitcoin Crashes to $63K Rebounds to $68.5K While Whales Accumulate — Spotted Crypto